Chapter 5: Showing Timelines
The most compelling visualizations often succeed because they tell a story; they extract a narrative from data and reveal that narrative to their users. And as with any narrative, time is a critical component. If the data consists solely of numbers, a standard bar or line chart can easily show its evolution over time. If the data is not numerical, however, standard charts probably won’t work. This chapter considers several alternatives for time-based visualizations. All are based on some variation of a timeline; one linear dimension represents time, and events are places along that dimension based on when they occurred. In all of the examples, we’ll consider the same underlying data: a possible chronology of the plays of William Shakespeare.
We’ll look at three very different approaches for adding timelines to web pages. One option relies on a JavaScript library, and it follows a process similar to many other visualizations in the book. The other two techniques, however, offer a different perspective. In one, we won’t use a visualization library at all. Instead, we’ll build a timeline with basic JavaScript, HTML, and CSS, and we’ll see how to do that both with and without jQuery. The final example shows the other extreme. It relies on a full-featured web component available from an external web site. In short, we’ll look at:
- How to use a library to create timelines.
- How to create timelines without a library using only JavaScript, HTML, and CSS.
- How to integrate a timeline component in a web page.
Building Timelines with a Library
First, we’ll build the timeline using the Chronoline.js library, which works a lot like most of the other JavaScript libraries we’ve used in the book. You include the library in your page, define your data, and let the library create the visualization.
Step 1: Include the Required Libraries
The Chronoline.js library itself depends on a few other libraries, and we’ll need to include all of them in our pages.
All of these libraries are popular enough for public content distribution networks to support, so we’ll use CloudFlare’s CDN in the following markup. We’ll have to use our own resources, however, to host Chronoline.js itself. That library also defines its own style sheet.
Note: Chapter 2 includes a more extensive discussion of content distribution networks and the trade-offs involved in using them.
1 2 3 4 5 6 7 8 9 10 11 12 13 14 15 16 17 18 19 20 21 22 23 | |
As you can see, we’ve set aside a <div> in line 10 to hold our timeline. We’ve also included the JavaScript libraries as the last part of the <body> element, as that provides the best browser performance.
Step 2: Prepare the Data
The data for our time line comes from Wikipedia. As a JavaScript object, that data might be structured like the following excerpt:
1 2 3 4 5 6 7 8 9 10 11 12 13 14 15 16 17 18 19 20 21 22 23 24 | |
You can see the complete data set in the book’s source code.
Before we can use Chronoline.js, we have to convert the raw data into the format the library expects. Since we have jQuery available, we can take advantage of its .map() function for the conversion. (For details on .map(), see chapter 2.)
1 2 3 | |
As you can see from our data set, some of the plays have a single year as their date, while others have a range of years (two dates separated by a dash). To set the date range for Chronoline.js, we check for a dash on line 4. If one is present, we split the date string at that dash and set a multi-year range in line 6. Otherwise we set the range to a single year in line 9.
Recall that the JavaScript
Date()object numbers months beginning with the value0rather than1.
1 2 3 4 5 6 7 8 9 10 11 12 13 14 | |
Step 3: Draw the Timeline
To draw the timeline, we create a new Chronoline object, passing it the HTML container element, our event data, and any options. The HTML container element should be a native element, not a jQuery selection. To convert from a selection to a native element, we use the get() method. In this case, we want the first element, so we use the parameter 0.
1 2 3 | |
If we try to use the default options of Chronoline.js with our data, however, the result is quite disappointing. (In fact, it’s illegible and not worth reproducing at this point.) We can fix that in the next step with some additional options.
Step 4: Set Chronoline.js Options for the Data
The Chronoline.js library has default options that are well suited for its original application, but they don’t work so well for Shakespeare’s plays. Fortunately, we can change the options from the default values. As of this writing, Chronoline.js doesn’t have much documentation on its options; to see the full set you would normally have to examine the source code. We’ll cover the most important options here, though.
One of the most obvious problems with the Chonoline.js defaults is the date shown in the initial view. Chronoline.js starts by displaying the current date by default. Since our timeline ends in 1613, the user would have to scroll backward for a long time to see anything meaningful. We can change this view by giving Chronoline.js a different start date for the initial view:
1 | |
As long as we’re setting the timeline to start somewhere close to Shakespeare’s lifetime, there’s no need for Chronoline.js to add a special mark for the current date, so we use this simple option to tell it not to bother:
1 | |
The next major problem to address is the labeling. By default, Chronoline.js tries to label every day on the timeline. As our events span 24 years, we don’t need that granularity. Instead, we can tell Chronoline.js just to label the years. For the same reason we also need to change the tick marks. Instead of every day, we need tick marks only for every month.
To change both of these options, we supply Chronoline.js with a pair of functions to call. Chronoline.js passes each of these functions a date object, and the functions return true or false depending on whether the date merits a tick mark or label. For tick marks we return true only on the first day of the month. We return true for labels only on January 1. (Remember that JavaScript numbers months beginning with 0.)
1 2 3 4 5 6 | |
By default, Chronoline.js will try to show a full date for each label. Since we only want to label each year, we’ll change the label format to just show the year. The details for the format specification are based on a standard C++ library.
1 | |
For our last adjustments to the labeling, we remove the “sub-labels” and “sub-sub-labels” that Chronoline.js adds by default. Those labels don’t provide any value in our case.
1 2 | |
We also want to change the span of time that Chronoline.js displays in the timeline. For our data, showing a span of five years at a time seems good.
1 | |
Note that the variable DAY_IN_MILLISECONDS is defined by Chronoline.js itself. We’re free to use it in this or in any other option setting.
Now we can address the timeline scrolling. Chronoline.js normally advances the timeline by a single day with each click. That would result in some rather tedious scrolling for our users. Instead of the default behavior, we’ll have Chronoline.js advance by a full year. As with the labels, we change this behavior by supplying Chronoline.js with a function. That function is passed a date object, and it should return a new date object to which Chronoline.js should scroll. In our case, we simply add or subtract one from the year value.
1 2 3 4 5 6 | |
The last few adjustments clean up the appearance and behavior of Chronoline.js. Adding some extra space (in our case three months) before the start and after the end of the timeline gives the data a bit of room.
1 | |
We can also make the scrolling animate smoothly instead of jumping, give users the ability to drag the timeline right or left, and improve the default browser tool tips.
1 2 3 | |
For the final tweaks, we can change the appearance of the timeline. To change the color and size of the events, we use options:
1 2 3 4 5 6 | |
To change the color of the scroll buttons, we have to modify the chronoline.css stylesheet. The property to change is background-color.
1 2 3 4 5 6 | |
With those changes, we finally have a timeline of Shakespeare’s plays.
The resulting timeline looks pretty good, but the limitations of the library make it difficult to customize and enhance the timeline further. Next, we’ll build a new timeline from scratch without the library, so we have complete control.
Building Time Lines with JavaScript
If you followed the example in the previous section, you might not be completely satisfied with the results. We did end up with an accurate timeline of Shakespeare’s plays, but the resulting visualization may not be communicating what you want. For example, the timeline doesn’t show the names of the plays unless the user hovers a mouse over that section of the graph. Perhaps we’d rather have the plays’ titles always visible. That kind of problem is a limitation of third-party libraries. The author of Chronoline.js didn’t see the need for displaying titles, so he didn’t offer the option. And unless we’re willing to take on the potentially daunting task of modifying the library’s source code, we can’t make the library do exactly what we want.
Fortunately, particularly in the case of timelines, we can take a completely different approach. We can create visualizations without using any third-party library at all, which will give us total control over the result. Timelines are especially amenable to this technique because they can be created with nothing more than text and styling. All it takes is a basic understanding of HTML and CSS, plus enough JavaScript to set things up and perhaps provide simple interactions.
That’s exactly what we’ll do in this example. We’ll start with the same data set as before. Instead of feeding that data into a third-party library, however, we’ll use plain old JavaScript (with an optional dose of jQuery) to construct a pure HTML representation of the data. Then we’ll use CSS to set the appearance of the timeline.
Step 1: Prepare the HTML Skeleton
Without any required libraries, the HTML page for our timeline is pretty simple. All we need is a containing <div> with a unique id attribute in line 8.
1 2 3 4 5 6 7 8 9 10 | |
Step 2: Start JavaScript Execution
As soon as the browser has finished loading our page, we can start processing the data. As before, we’ll start with our data formatted as a JavaScript array. You can see the complete data set in the book’s source code.
1 2 3 4 5 6 7 8 9 10 11 12 13 14 15 16 17 18 19 20 21 22 23 24 25 26 | |
Step 3: Create the Timeline in Semantic HTML
To create the timeline in HTML, we first need to decide how to represent it. If you’re used to working with arbitrary <div> and <span> elements, you might think that’s the best approach here as well. Instead of jumping right to these generic elements, however, we should consider other HTML structures that more accurately convey the content. HTML that more closely reflects the meaning of the underlying content is known as semantic markup, and it’s usually preferred over generic <div> and <span> tags. Semantic markup exposes the meaning of your content to computers such as search engines and screen readers for users with visual impairments, and it can improve your site’s search rank and its accessibility. If we think about a timeline in the context of semantic markup, it’s easy to see that the timeline is really just a list. In fact, it’s a list with a specific order. We should build our HTML timeline, therefore, as an ordered list (<ol>) element. While we’re creating the <ol> we can also give it a class name for CSS style rules we’ll be adding later.
1 2 3 4 | |
Next we can iterate through the plays, creating an individual list item <li> for each one. For now, we’ll just insert the date and title as text.
1 2 3 4 5 | |
Here’s a truncated version of the resulting list. It may not look like much (yet), but it has the essential data and structure.
If you look at the resulting HTML that underlies that list, it’s pretty simple:
1 2 3 4 5 6 7 | |
In the spirit of semantic HTML, we should stop and consider whether that markup can be improved. Since it appears first in our list items, let’s consider the date or date range for a play. Although there has been some controversy around the decision, HTML5 has defined support for a <time> element to contain dates and times. Using that element as a wrapper will make our dates more semantic. The second part of each list item is the title of the play. As it happens, HTML5’s <cite> element is perfect for that content. To quote the current standard:
The cite element represents the title of a work (e.g. a book, […] a play, […] etc). This can be a work that is being quoted or referenced in detail (i.e. a citation), or it can just be a work that is mentioned in passing. [Emphasis added.]
To add those elements to our code, we’ll have to distinguish between dates that are single years and those that are ranges. Looking for a dash - in the data will tell us which we have. Notice how we handle date ranges in lines 4 through 10. Since a range has a start and end time, we create two distinct <time> elements. We don’t need to add any punctuation between the dates at this point.
1 2 3 4 5 6 7 8 9 10 11 12 13 14 15 16 17 18 19 20 | |
Because we’re no longer including the punctuation, the resulting output might look a little worse than before. Don’t worry, though, we’ll fix it soon.
What is much improved is the underlying HTML. The markup clearly identifies the type of content it contains: an ordered list of dates and citations.
1 2 3 4 5 6 7 | |
Step 4: Include the Supporting Content
When we created a timeline using the Chronoline.js library, we weren’t able to include the supporting content from Wikipedia because the library did not offer that option. In this example, though, we have complete control over the content, so let’s include that information in our timeline. For most plays our data includes its first official record, its first publication, its first performance, and a discussion of the evidence. This type of content is perfectly matched to the HTML description list <dl> so that’s how we’ll add it to our page. It can follow the <cite> of the play’s title.
1 2 3 4 5 6 7 8 | |
We can define a mapping array to help add the individual terms to each play. That array maps the property name in our data set to the label we want to use in the content.
1 2 3 4 5 6 | |
With that array we can quickly add the descriptions to our content. We iterate over the array using .forEach(). At each iteration we make sure that the data has content (line 6) before creating the description item. A description item contains the term(s) being described in one <dt> tag and the description itself in a <dd> tag.
1 2 3 4 5 6 7 8 9 10 11 12 13 14 15 16 17 | |
Our timeline is still lacking a bit of visual appeal, but it has a much richer set of content. In fact, even without any styling at all, it still communicates the essential data quite well.
Here’s the resulting markup (truncated for brevity):
1 2 3 4 5 6 7 8 9 10 11 12 13 14 15 16 17 18 19 20 21 22 | |
Step 5: Optionally Take Advantage of jQuery
Our code so far has used nothing but plain JavaScript. If you’re using jQuery on your web pages, you can shorten the code a bit by taking advantage of some jQuery features. If your web pages aren’t using jQuery already, the minor enhancements in this step don’t justify adding it, but if you’d like to see a more concise version, check out the book’s source code for an alternative.
Step 6: Fix Timeline Problems with CSS
Now that we’ve built our timeline’s content in HTML, it’s time to define the styles that determine its appearance. Throughout this example we’ll focus on the functional aspects of styling rather than pure visual elements such as fonts and colors, since you’ll probably want those visual styles to be specific to your own web site.
The first step is a simple one. We want to get rid of the numbering (1, 2, 3, …) that browsers normally add to ordered list items. A single rule banishes them from our timeline: by setting the list-style-type to none we tell the browser not to add any special characters to our list items.
1 2 3 | |
We can also use CSS rules to add some punctuation to our semantic HTML. First we look for places where two <time> elements appear right after each other, while skipping isolated <time> tags. The trick to finding <time> pairs is the CSS adjacent selector +. A rule with time + time specifies a <time> element that immediately follows a <time> element. To add the punctuation, we use the :before pseudo-selector to specify what we want to happen before this second <time> tag, and we set the content property to indicate the content we want inserted.
1 2 3 | |
If you haven’t seen the > before in a CSS rule, it’s the direct descendant selector. In this example, it means that the <time> element must be an immediate child of the <li> element. We’re using this selector so our rules won’t inadvertently apply to other <time> elements that may be nested deeper within the list item’s content.
To finish up the punctuation, let’s add a colon and space after the last of the <time> elements in each list item. We have to use two pseudo-selectors for this rule. The :last-of-type selector will target the last <time> element in the list item. That’s the first <time> if there’s only one and the second <time> if both are present. Then we add the :after pseudo-selector to insert content after that <time> element.
1 2 3 | |
With these changes we’ve cleaned up all of the obvious problems with our timeline.
-
The Two Gentlemen of Verona
- First official record
- Francis Meres’…
- First published
- First Folio (1623)
- First recorded performance
- adaptation by…
- Evidence
- The play contains…
-
The Taming of the Shrew
- First official record
- possible version…
- First published
- possible version…
- First recorded performance
- According to Philip…
- Evidence
- Kier Elam posits…
Now we can add a little flair to the visualization.
Step 7: Add Styles to Visually Structure the Timeline
The next set of CSS styles will improve the visual structure of the timeline. First among those improvements will be making the timeline look more like, well, a line. To do that, we can add a border to the left side of the <li> elements. At the same time, we’ll also want to make sure that those <li> elements don’t have any margins, as margins would introduce gaps in the border and break the continuity of the line.
1 2 3 4 5 6 7 | |
These styles add a nice vertical line on the left side of our entire timeline. Now that we have that line, we can shift the dates over to the left side of it. The shift requires rules for the parent <li> as well as the <time> elements. For the parent <li> elements, we want their position specified as relative.
1 2 3 | |
By itself, this rule doesn’t actually change our timeline. It does, however, establish a positioning context for any elements that are children of the <li>. Those children include the <time> elements that we want to move. With the <li> set to position: relative, we can now set the <time> children to position: absolute. This rule lets us specify exactly where the browser should place the time elements, relative to the parent <li>. We want to move all <time> elements to the left, and we want to move the second <time> element down. In the following code the first selector targets both of our <time> tags while the second selector, using the same time + time trick described earlier, targets only the second of two <time> tags.
1 2 3 4 5 6 7 8 | |
By using em units rather than pixel px units for this shift, we define our shift to be relative to the current font size, regardless of what it is. That gives us the freedom to change the font size without having to go back and tweak any pixel positioning.
The specific values for the position shift may need adjustment depending on the specific font face, but, in general, we use a negative left position to shift content farther to the left than it would normally appear, and a positive top position to move the content down the page.
After moving the dates to the left of the vertical line, we’ll also want to shift the main content a bit to the right so it doesn’t crowd up against the line. The padding-left property takes care of that. And while we’re adjusting the left padding we can also add a bit of padding on the bottom to separate each play from the other.
1 2 3 4 | |
With the dates and the main content on opposite sides of our vertical line, we no longer need any punctuation after the date, so we’ll remove the style that adds a colon after the last <time> element.
1 2 3 | |
The fact that we’re able to make this change highlights one of the reasons for using CSS to add the colon in the first place. If we had included the punctuation explicitly in the markup (by, for example, generating it in the JavaScript code), then our markup would be more tightly coupled to our styles. If a style modification changed whether the colon was appropriate, we would have to go back and change the JavaScript as well. With the approach that we’re using here, however, styles and markup are much more independent. Any style changes are isolated to our CSS rules; no modifications to the JavaScript are required.
To further improve its visual styling, we can make a few other changes to our timeline. We can increase the font size for each play’s title to make that information more prominent. At the same time, we can add some extra spacing below the title and indent the description list a bit.
1 2 3 4 5 6 7 8 | |
For a last bit of polish, let’s add a bullet right on the vertical line to mark each play and tie the title more closely to the dates. We use a large bullet (several times the normal size) and position it right over the line. As you can see from the following rules, the Unicode character for a bullet can be represented as "\2022". The exact position values will depend on the specific font, but a bit of trial and error can perfect the adjustments.
1 2 3 4 5 6 7 8 | |
Now our timeline is starting to look like an actual time line. In your own pages you could include additional styles to define fonts, colors, and so on, but even without those decorations the visualization is effective.
-
The Two Gentlemen of Verona
- First official record
- Francis Meres’…
- First published
- First Folio (1623)
- First recorded performance
- adaptation by…
- Evidence
- The play contains…
-
The Taming of the Shrew
- First official record
- possible version…
- First published
- possible version…
- First recorded performance
- According to Philip…
- Evidence
- Kier Elam posits…
Step 8: Add Interactivity
The full details on all 40 of Shakespeare’s plays might be a little overwhelming for a first view of our timeline. The visualization would be more effective if it showed only the play titles at first, but let users reveal more details through interactions. Because we’re building this visualization ourselves, we have all the control necessary to make that happen.
First we’ll set up a few additional styles. There are several ways to hide the play details with CSS, the most obvious being the display:none property. As we’ll see a little later though, a better choice for our timeline is setting the max-height to 0. If the maximum height of an element is 0, then, in theory, it should be invisible. In practice, we also have to set the overflow property to hidden. Otherwise, even though the <dl> element itself has no height, the browser will display the content that overflows from it. Since we want our description lists to start out hidden, we can set that property as the default.
1 2 3 4 | |
To reveal a play’s details, users click on the play’s title in the <cite> element. To indicate to users that they can click on the title, we’ll change the mouse cursor from the normal arrow to the “clickable” hand. We can also change the display property from the default inline to block. That change gives users a larger and more consistent area to click.
1 2 3 4 | |
Finally, we need a way to reveal a play’s details. We’ll do that by adding a class of "expanded" to the <li> for the play. When that class is present, our styles should override the max-height of 0.
1 2 3 | |
The exact value for the expanded max-height will depend on the content. In general, though, it should be large enough to reveal the full details for the item. It’s okay to make it a little larger than necessary “just in case.” Don’t go overboard, however, and make it unreasonably large. (We’ll see why at the end of this step.)
With these styles in place, we can add a bit of JavaScript to control them. It won’t take much. The first step is writing an event handler that will be called when users click. That function will take a single parameter, specifically an Event object, with details about the click. One of those details is the .target property, which will contain a reference to the specific element of the page on which the user clicked. We care only about clicks on the <cite> elements.
1 2 3 4 5 | |
Once we know that a <cite> was clicked, we find its parent <li> element. We can then check to see if the <li> has the "expanded" class. If it doesn’t, we add it. If the class is already present, we remove it. Our approach is a bit primitive because it allows only one class to be defined for the <li>. That’s all we need for this example, though, so we’ll stick with it.
1 2 3 4 5 6 7 8 9 10 | |
Note: Modern browsers have a more sophisticated interface for controlling the class attributes of elements. That interface is the
classList, and it easily supports multiple classes per element, as well as toggling the class on and off with a single function. Older browsers (namely Internet Explorer version 9 and earlier) don’t support that interface, however. Since we don’t need the extra functionality, the olderclassNameis sufficient for this example.
With our event handling function defined, we can associate it with clicks anywhere on the timeline. The standard addEventListener method creates the association for any element.
1 | |
Note: You might be curious as to why we’re associating an event listener with the entire timeline visualization instead of, for example, adding individual event listeners to each
<cite>. That alternative would eliminate the need to check the event target in the handler; however, it turns out that it’s much less efficient than the approach we’re taking. Event listeners can consume a fair bit of JavaScript resources, and our page will perform better if we keep them to a minimum.
If you’re using jQuery, the required code is even simpler:
1 2 3 | |
We’re almost ready to show our new and improved timeline to the world, but there’s one final refinement we can make. Our current version shows or hides a play’s details all at once. This transition can be abrupt to users, as content appears or disappears instantly. We can provide a better experience by gracefully transitioning between the two states, and a natural transition for this timeline is animating the height of the content. When the details are hidden, they have a height of 0. And when we want to show them, we will gradually animate the height to its natural value.
It’s possible to add these animations using JavaScript. The jQuery library, in fact, has a fairly extensive set of animation functions. In modern browsers, however, it is much better to animate content using CSS transitions. Web browsers are optimized for CSS, often offloading the computations to special high-performance graphics co-processors. In those cases CSS-based animations can perform several orders of magnitude better than JavaScript. The only disadvantage to using CSS for animations is a lack of support in older browsers. But animation isn’t usually critical to most web pages. Sure, it’s nice, but if a user with an older browser misses out on the graceful transitions, it isn’t the end of the world. The web page will still function just fine.
The CSS transition property is the simplest way to define a CSS animation. It specifies the actual property to animate, the duration of the animation, and the easing function to follow. Here’s a rule we could use in our example:
1 2 3 | |
This rule defines a transition for the timeline’s <dl> elements. It specifies that the property to animate is max-height, so the transition will take effect whenever an element’s max-height property changes (and that’s precisely the property we modify when the "expanded" class is added or removed). The transition rule also specifies that the animation should take 500 milliseconds, and that it should “ease in” and “ease out.” This last property indicates that the animation should start slowly; speed up, and then slow down again before finishing. That behavior usually looks more natural than animating at a constant speed.
CSS transitions can animate many CSS properties, but there is one important constraint. Both the starting and ending values must be explicit. That constraint explains why we’re animating max-height instead of height, even though it’s really just height that we want to change. Unfortunately, we can’t animate height because it has no explicit value when the description list is expanded. Every <dl> will have its own height based on its content, and there’s no way we can predict those values in our CSS. The max-height property, on the other hand, gives us explicit values for both states—0 and 40em in this example—so CSS can animate its transitions. We just have to be sure that no <dl> has content more than 40em high. Otherwise, the extra content will be cut off. This doesn’t mean, however, that we should set the max-height for expanded <dl> elements to an astronomical value. To see why, consider what would happen if we transitioned max-height to 1000em for a <dl> that needed only 10em of height. Ignoring (for simplicity) the complications of easing, it would only take 1/100th of the full transition time before the full content of the element was visible. The animation that we had planned to take 500 milliseconds is over in 5 milliseconds instead.
There is one final complication with CSS transitions. Most browsers implemented the functionality before the official standard was finalized. To make sure their implementations wouldn’t conflict with potential changes in the official standards, browser vendors initially implemented transitions using a proprietary syntax. That syntax adds a prefix (-webkit- for Safari and Chrome, -moz- for Firefox, and -o- for Opera) to the property name. To cover all the major browsers, we must include a rule with each prefix.
1 2 3 4 5 6 | |
Note: Internet Explorer doesn’t need a prefix because Microsoft didn’t implement transitions until the standard was stable. Also, there’s no harm in specifying multiple prefixes since browsers simply ignore properties they don’t understand.
Now our hand-crafted timeline responds perfectly to user interactions. Here’s the complete visualization.
Using a Web Component
In this example, we’ll look at another alternative approach; instead of building a timeline from scratch using low level JavaScript, we’ll integrate a full-featured timeline component: Timeline JS. In many ways this approach is the exact opposite of low-level JavaScript. At its most basic, it requires no coding at all, as it can be as easy as embedding a YouTube video in a blog post. That method sacrifices a lot of control over the resulting visualization, however, so we’ll also look at ways to regain some of that control.
Step 1: Preview the Standard Component
Before we spend too much time customizing the visualization, it’s worthwhile to check out the component in its most basic form. Fortunately, Timeline JS makes this process very simple. The web site will walk you through the steps in detail, but in a nutshell, they are:
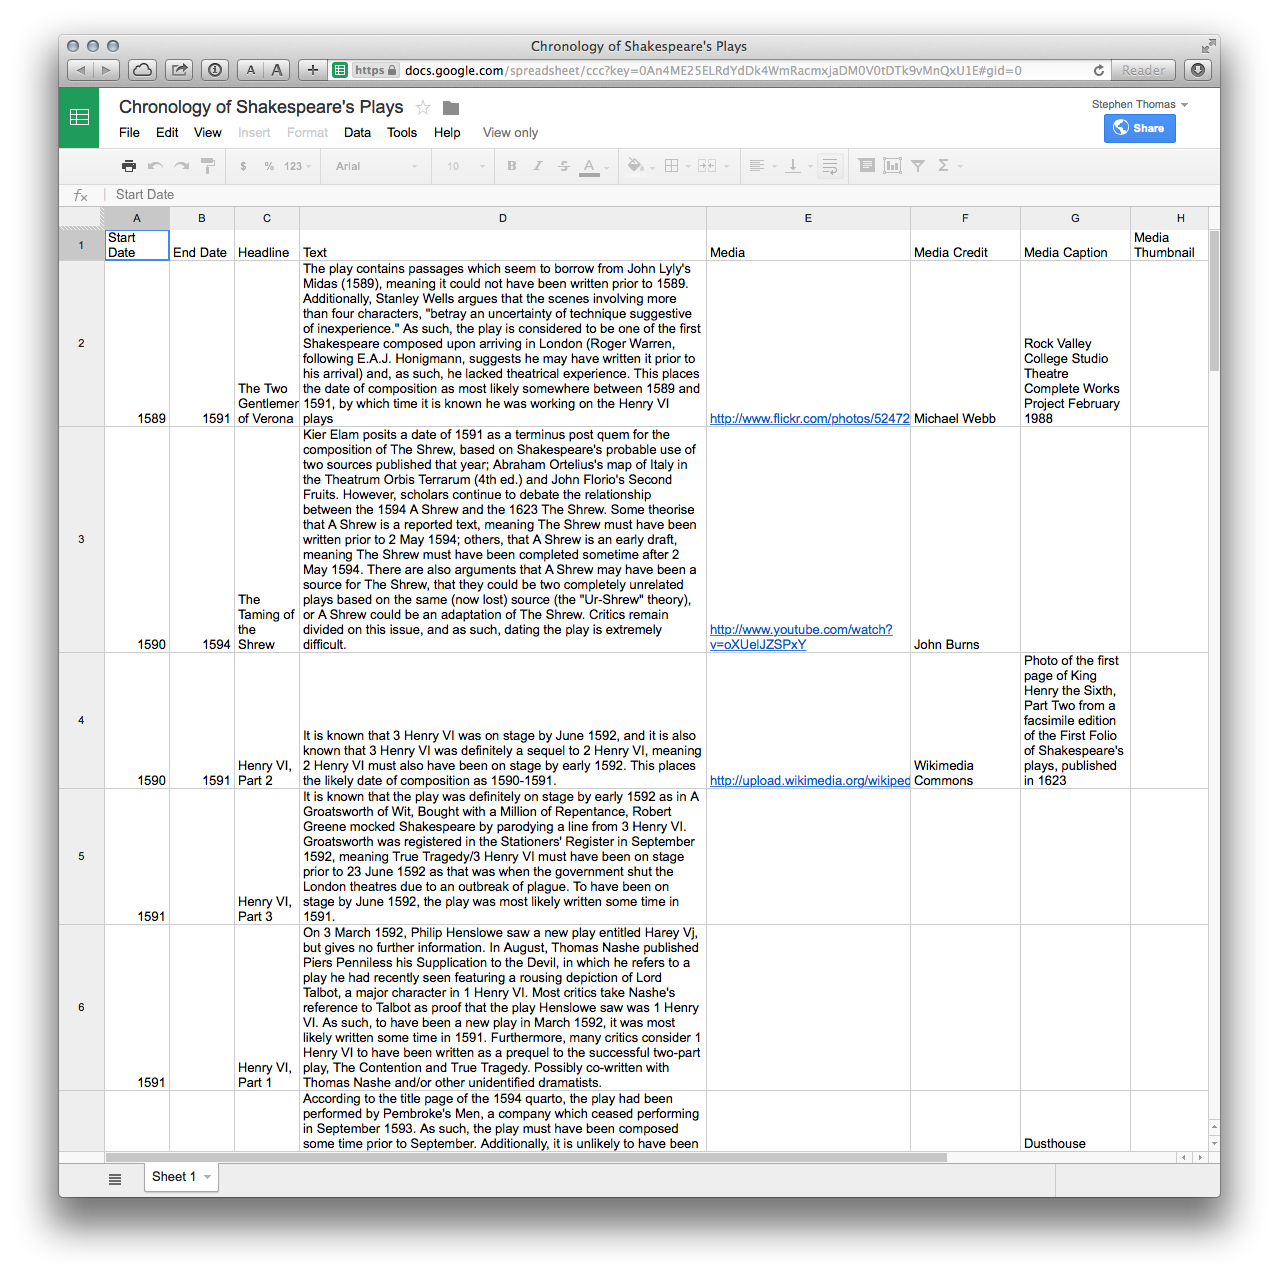
- Create a Google Docs spreadsheet with data for the timeline.
- Publish that spreadsheet for web access, which will create a URL for it.
- Enter that URL into a form on the Timeline JS web site, which will generate an HTML snippet.
- Copy and paste the snippet into your web page.
Figure shows what the spreadsheet looks like for Shakespeare’s plays.
The HTML snippet that Timeline JS creates for this timeline is as follows:
1 2 3 4 5 6 | |
When included in a page, that snippet results in fully interactive timeline for the chronology as shown in figure .
If the result meets the needs of your visualization, you may not have to go any further. Many web pages that use Timeline JS do so in exactly this manner. There are some potential problems with the simplest approach, however:
- The data for the visualization must be available in a public Google Docs spreadsheet, so the approach may not be appropriate for confidential data.
- The data source is a spreadsheet, so it may be difficult to update it often or show more real-time events. This problem doesn’t really affect our Shakespeare chronology, but if the timeline you’re creating shows real-time data such as trending topics on a social network, a static spreadsheet won’t be practical.
- The embedded component has few styling options. Although the default styles and options that Timeline JS offers are quite attractive, they are very limited and may not be appropriate for your web page.
- The timeline is embedded as an
<iframe>, which gives Timeline JS complete control over what is displayed in that section of your page. While there is absolutely no indication that the organizations supporting Timeline JS would do so, in theory they could alter the content (for example by including ads) in ways that your site might not find appropriate.
Fortunately, none of these possible concerns need prevent us from adding beautiful Timeline JS visualizations to our web pages. The folks behind Timeline JS make all of the software available as open source, giving us the flexibility to address all of the aforementioned issues. We’ll see how in the rest of this example.
Step 2: Include the Required Components
To use Timeline JS, our web pages must include CSS stylesheets and JavaScript code. For now we’ll stick with the default styles, so we need only a single additional style sheet. The main JavaScript is contained in timeline.js.
It’s not obvious, but Timeline JS also requires jQuery. When you embed a Timeline JS <iframe> your main web page doesn’t have to include jQuery because the <iframe> will include it. To integrate the timeline directly in our page, though, we have to include jQuery explicitly. We can, however, use a content distribution network instead of hosting it ourselves.
See chapter 2 for more details on the advantages and disadvantages of content distribution networks.
1 2 3 4 5 6 7 8 9 10 11 12 13 14 | |
The HTML at this point doesn’t include the element in which we’ll place the timeline. There are some special constraints on that element, which we’ll consider when we add it to the page.
Step 3: Prepare the Data
Because Timeline JS supports several features that we haven’t used in the earlier examples, we’ll add a few additional properties to our data set. The overall format, though, looks the same as before:
1 2 3 4 5 6 7 8 9 10 11 12 13 14 15 16 17 18 19 20 21 22 23 24 25 26 27 28 29 30 | |
As you can see, we’ve added genre information to the plays, as well as optional multimedia links, and text for credits and captions. With that starting point, we can rearrange the data to match what Timeline JS expects. The basic structure of that object, shown next, includes some overall properties (such as the headline), and an array of events. We can initialize it to an empty array.
1 2 3 4 5 | |
Note that the type property is required and should be set to "default".
Now we iterate through the data set adding events to timelineData. For the following code we’ll use forEach for this iteration, but there are plenty of alternatives we could use here (including for loops, array .map() methods, or jQuery’s $.each() and $.map() functions). The first step in each iteration is parsing the date information. It can take one of two forms: either a single year ("1591") or a range of years ("1589-1591"). Our code assumes a single date and makes adjustments if it finds two.
1 2 3 4 5 6 7 8 9 | |
Now we can provide the full entry for the event in Timeline JS format by pushing the new object into the timelineData.date array.
1 2 3 4 5 6 7 8 9 10 11 12 | |
Step 4: Create a Default Timeline
With our HTML set up and our data set prepared, we can now call Timeline JS to create its default visualization. Figuring out exactly how to do that, however, isn’t quite as simple as looking in the documentation. That’s because Timeline JS assumes that it will be used primarily as an embedded and isolated component rather than an integrated part of a page. The documentation, therefore, describes how to use Timeline JS using the storyjs_embed.js wrapper for embedded content. That wrapper loads all the Timeline JS resources (style sheets, JavaScript, fonts, and so on), and if we use it as intended, we’ll end up with most of the same problems as if we had simply embedded an <iframe>.
Fortunately, it’s not too difficult to skip all the embedding and simply access the JavaScript code directly. It requires only three steps:
- Set up the configuration object.
- Create a Timeline JS object.
- Initialize the object using the configuration object.
Here’s what these steps will look like in our JavaScript, with the details omitted for now:
1 2 3 | |
We still need to fill in the exact configuration object and the parameters for the VMM.Timeline constructor. The configuration object is documented in the Timeline JS source. We must provide a type (equal to "timeline"), dimensions, the data source, and the id of the HTML element into which the timeline should be placed. For example, we could use:
1 2 3 4 5 6 7 | |
We have to pass many of those same parameters to the constructor. In particular, we provide the container’s id and the dimensions.
1 | |
Finally we have to build our HTML markup with care. Timeline JS styles its HTML appropriately for an embedded <iframe>, but those styles aren’t as compatible with a timeline that’s integrated in the page. In particular, it positions the timeline absolutely and sets its z-index. If we don’t compensate, the timeline will float out of the flow of the page content, which is almost certainly not desirable. There are several ways to adjust for this issue, and we’ll use a simple one in this example. Instead of a single <div>, we use two nested <div> elements. The inner <div> will contain the timeline, and the outer <div> establishes both a positioning context and size for the timeline.
1 2 3 | |
Now when our JavaScript executes, it produces the integrated timeline shown in figure with the default Timeline JS styling.
Before we leave this step it’s worth considering how we’ve reached this point. We’ve taken a complete web component with explicit instructions for its use, and we’ve ignored those instructions. Instead, we’ve included only part of the component (albeit a major part). Figuring out how to use an isolated part of a web component (in a way that it isn’t necessarily intended for) can involve some guesswork and trial and error, and there is clearly some risk in this approach. Even if you manage to get it working now, a future update might invalidate your implementation. If you adopt this approach with your web site, it’s a good idea to test the implementation thoroughly and to take extra care with any updates.
Step 5: Adjust the Timeline Styles
Now that we’ve addressed the issues that an <iframe> can cause, we can turn our attention to the timeline’s appearance. The timeline.css stylesheet determines that appearance, and there are several alternatives for adjusting it.
- Modify
timeline.cssdirectly. Although this approach might seem the most obvious, it’s probably not what we should do. If you look at the file, you’ll notice that it’s compressed CSS that’s difficult to read and understand. Making the appropriate modifications will be challenging. Furthermore, if we later update to a new version of Timeline JS, that new version may well have a newtimeline.cssfile, and we’d have to start all over again. - Work with the source code. Timeline JS authors its styles using the LESS CSS preprocessor. If you’re comfortable using a CSS preprocessor, you could modify the source and build your own custom version of
timeline.css. LESS has support for variables and mixins that make it easier to accommodate updates in the future. There are many applications that compile LESS into CSS; Timeline JS uses CodeKit, which is available only for Apple’s Mac OS X, and the source code includes all of the appropriate application settings. - Supersede
timeline.cssstyles. Instead of changing the Timeline JS stylesheet, leave it as is and add custom styles with a higher priority than the default styles. This approach takes advantage of the cascade in Cascading Style Sheets.
For this example we’ll use the third approach. We’ll identify the timeline.css styles that we want to change and add new rules to our stylesheet to take precedence over those styles. When CSS finds that multiple, conflicting rules apply to an element, it resolves the conflict by considering the specificity of the rules and their order in the document. We can give our rules priority by making them more specific than the timeline.css rules, or by making them equally specific but including them after timeline.css.
First we’ll tackle the fonts that Timeline JS uses. There’s nothing wrong with the default or optional fonts, but they may not match the style of our web page. In addition, downloading extra fonts will slow the performance of the page. The quickest way to find the styles that affect fonts is to look at one of the optional font selections that Timeline JS offers on its web site. For example, if you select the “Merriweather & News Cycle” option, you’ll see that Timeline JS adds an additional stylesheet to the visualization. That file is NewsCycle-Merriweather.css, which defines all the font rules for the option:
1 2 3 4 5 6 7 8 9 | |
To use our own fonts, all we need to do is copy that file and replace 'News Cycle' and 'Merriweather' with our own choices—in this case, Avenir.
1 2 3 4 5 6 7 8 9 10 | |
Customizing other aspects of the Timeline JS visualization are more challenging but not impossible. These customizations are rather fragile, however, as even the slightest change in the Timeline JS implementation could render them ineffective. If it’s important for your page, though, it can be done.
For our example we’ll change the blue color that Timeline JS uses in the bottom section of the visualization. It uses that color to highlight the active item, show the timeline marker, and for the event line. Finding the specific rules to override takes a bit of detective work with your browser’s developer tools, but here’s how to change the color from blue to green:
1 2 3 4 5 6 7 8 9 10 11 12 13 14 15 16 | |
Combining font changes with the alternative color scheme helps the visualization integrate more seamlessly in an overall web page, as figure shows.
Summing Up
In this chapter we’ve looked at a wide range of approaches for creating timeline visualizations. The most familiar approach relies on an open source library, but we also considered two other options. In one, we developed the code for a timeline from scratch, which gave us complete control over its appearance and behavior. For the other extreme, we examined a popular open source web component. Pages normally use that component by embedding <iframe> elements in the page, but we also saw that it’s possible to take the open source code and integrate it more seamlessly in our pages, even altering the visual styles if necessary.
Continue reading: Chapter 6: Visualizing Geographic Data.